
Technical Analysis of Global Financial Markets
Thursday, January 10, 2019
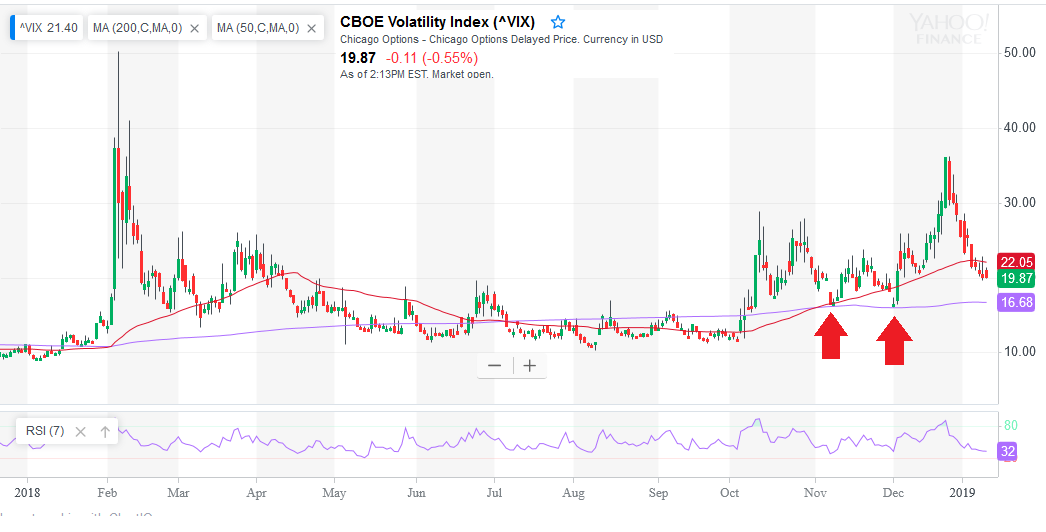
VIX: Watch The 200-Day Moving Average
Thursday, January 3, 2019
CFTC Special Announcement
During
the shutdown of the federal government, the Commitments of Traders
report will not be published. When the federal government operations
return to normal, CFTC will resume publication of the Commitments of
Traders report.
Tuesday, December 18, 2018
Getting Closer!!!!!

Monday, December 3, 2018
FX Markets Focused on 1.14 & 114

Meanwhile, the greenback is flirting with a trendline at Y114 after having traded right up to it last week before Fed Powell doused expectations for future rate hikes. While, the USD/JPY's trendline is not as steep as the EUR/USD's, it is part of a larger pattern, namely a 2-year triangle. This suggests that an upside break would carry more relevance for the pair compared to an upside breach of 1.14 for the EUR/USD.
While the US dollar continues to consolidate what has been a strong year, a solid indication which way it will go next could depend which will go first....114 or 1.14!
Wednesday, November 7, 2018
Watch These Key Fibonacci Retracement Levels

Take a look at the daily charts of the Nasdaq Composite and S&P 500 Index, both of which have rallied aggressively over the past few days. The Nasdaq is testing the 50% retracement level along with the 200-day moving average, while the S&P has gapped above both metrics. Both, however, have an area of potential resistance that highlight the last bull counter-rally rejection and a key Fibonacci retracement (61.8% of the latest range).
For the S&P 500, the key level to watch is 2812, which is awfully close to the 50-day MA at 2833, which served as key support over the past summer. If, over the next few days, this region manages to contain the recent rally, it could be setting-up for a key lower top to form.
That said, the rally in stocks has been rather impressive and is still showing significant momentum to the topside. Ideally, a hesitation of some sort (in strength) would be required to even hint of an imminent reversal. Thus, the most likely scenario in this case is a bullish exhaustion, which means either a large intra-day candlestick or bar that closes at or near the highs, that is near 2812 or 2833, or simply have a daily close near or just below these two key levels.
Monday, October 29, 2018
S&P Poised To Match Largest Corrective Dip of 10-year Bull Campaign
 The S&P 500 is poised to match the February decline (January 26th to February 9th) by points (342) and by percentage (-11.91%), also the largest pullback since the bull campaign started over 10 years ago. After Monday's close, the S&P 500 nearly tested these metrics at 2597, inching close in the final hour of trade before pulling back up into the finish.
For practical purposes, it can be said that the two down-moves are in symmetry in terms of size, the glaring difference is the disparity between the VIX now and then. Back in February after the initial thrust had been completed, volatility was nearly twice as high (50+ vs 27 ish now).
Whenever moves match previous moves in size, it can suggest a trend change is near. That said, it is extremely early to call a low at this point. In fact, other indices such as the Dow (DJIA) continue to highlight former support turned resistance at a clear psychological level (25K), which continue to suggest that bears remain overall in control in US equity markets.
If 2597 (S&P 500) is clearly taken-out to the downside, then look out! It would suggest a more meaningful decline is at hand and could suggest that the VIX elevates to the upper 30's before potentially exposing the critical 50 threshold that has exhausted previous points of paranoia.
Friday, October 26, 2018
Stocks Still Not Near The Bottom!

The earnings disappointment overnight, by the two of the largest companies in the world (namely Alphabet & Amazon) not only put pressure on the technology sector, but added near-term technical risks on all equity markets. More specifically, it puts the Dow in position to start trending lower towards the summer's lows near 24K while counter-rallies remain south of 25K and the 200-day Moving Average (near 25K). Friday's intra-day high briefly probed the October 11th swing low (24,899.70), which also hints that bears remain in control until bulls reclaim 25K and/or the 200-day MA on a daily closing basis.
Wild swings in the market can be tough to manage even for the most seasoned traders. That said, market sentiment and price-action have been rather orderly so far. Equity markets have been increasingly more volatile as seen in the latest bump-up in the VIX to the upper-20's, but nowhere near the panic spike to 50 seen earlier in the year and in 2016.

Moreover, the percent of stocks in the S&P 500 below their 200-day Moving Average broke below -2 standard deviations from the mean and looks like it may need to test the -3 standard deviations threshold similar to moves in 2015 & 2016, before truly bottoming-out.
This, however, does not imply that more volatility is imminent, but merely a reference point to what may be needed to shift both sentiment and price-action back up.
Subscribe to:
Posts (Atom)


